| |
 |
StatEL : Kruskal & Wallis test
|
|
|
|
| |
This test is equivalent to parametric Anova for comparison of K means from independent groups, but without requirement of sample distribution.
Example : we have 3 different growing environments for microalgea and we want to know if productivity is different between these 3 environments. Unfortunately, for economical reasons, we could not perform more than 5 tests on each environment. Preliminary analysis revealed that normal distribution of measures was not respected. Then, utilization of ANOVA is not possible. We must resort the nonparametric test of Kruskal & Wallis to compare the 3 means in order to know if gap between means is significant or simply due to chance.
1 - Principles of Kruskal & Wallis test :
We have several samples (K>2) whose means (mi, mj, ...) and variances (s²i, s²j, ...) are estimators of means (µi, µj, ...) and variances (θ²i, θ²j, ...) of populations from which samples are extracted. The problem is : si mi, mj, ... are differents (which is easy to check), is it the same for µi, µj, ... ?
- Null hypothesis : "H0 : µi = µj = ..."
- Alternative hypothesis : "H1 : there is at least one mean that is different from the others"
In any nonparametric test, and on the contrary of parametric tests, calculation does not take into account numeric values of measures from samples representative of the populations. Nonparametric tests are based on ranks of values. Then we are free of normal distribution conditions and homogeneity of variances, indispensable for liability of parametric tests.
- We begin to rank in rising order the whole values for the K studied groups.
- We calculate sum of ranks (Tk) for each of the k groups as well as total sum of ranks for all groups (T).
- We calculate ranks means (Rk = Tk/nk) for each group as well as ranks mean for all groups (R = T/N). Thus, in null hypothesis, mean gap between Rk and R should be very low.
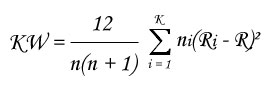
- We analyze significancy of the KW index by comparison with the limit value from the Khi² statistic table, only if each group has at least 5 measures :
- There is no condition to use Kruskal & Wallis test (excepted aleatory sampling).
At the end of Kruskal & Wallis test, StatEL resort a post-hoc test in order to define conclusions in case of rejection of H0. Indeed, Kruskal & Wallis test does not allow to specify which mean(s) is (are) different from the others.
Then, we proceed the "method of ranked means". This test consists in ranking means of different studied groups in rising order. We compare pair of contiguous means thanks to Mann & Whitney test. Thus, we proceede only (k-1) comparisons instead of the k(k-1)/2 possible comparisons.
At the end, we can have a result like : m5 = m1 < m4 < m3 = m2.
Note : it may happen that this posthoc test concludes no complementary information (m1 = m3 = m2) ; it hides the fact that difference is between m1 and m2 and not between m1 and m3 or between m3 and m2.
2 - Launch of Kruskal & Wallis test :
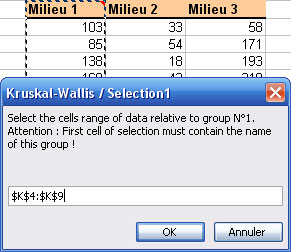
StatEL requires you to specify the number of different groups you want to compare. Then, you have to select successively the cells range related to each studied group. This dialog boxwill display as many time as the number of different groups to compare. To proceed the selection, you just have to clic on the first cell of your data with the mouse and to stretch until the last cell of your data.
Nota bene : in order to identify at the best different measures groups, first cell of each selection must contain name of the group. These names will be used in the results sheet.
3 - Results of Kruskal & Wallis test :
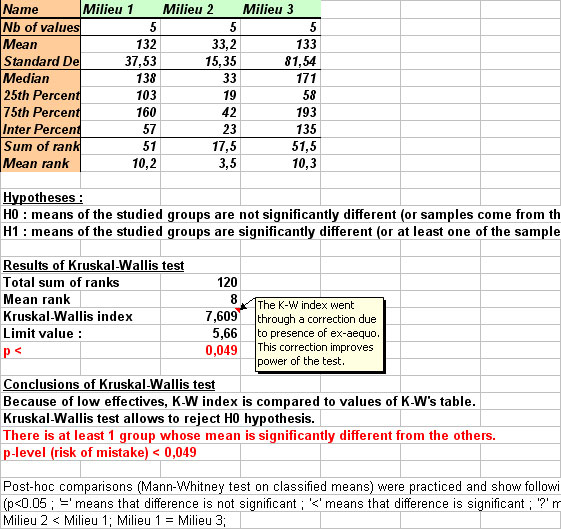
Results display on a new sheet of you Excel file :
- On the left part of the sheet, you can see table of selected data.
- On the right part of the sheet are displayed table of descriptive statistics, tested hypotheses, results of Kruskal & Wallis calculations, and Kruskal & Wallis conclusions. If results allow to reject H0 hypothesis, i.e. if at least one mean is significantly different, conclusions as well as p-value are written in red.
In the mentioned example, StatEL explains clearely that at least one mean is significantly different, with a p-value (risk to make a mistake) lower than 0,049.
It is also specified that presence of ex-aequo ranks justified utilization of a correction for calculation of Kruskal & Wallis index. The posthoc test practiced on ranked means allows to identify the 2nd environment as the only one whose mean is significantly differente from others.
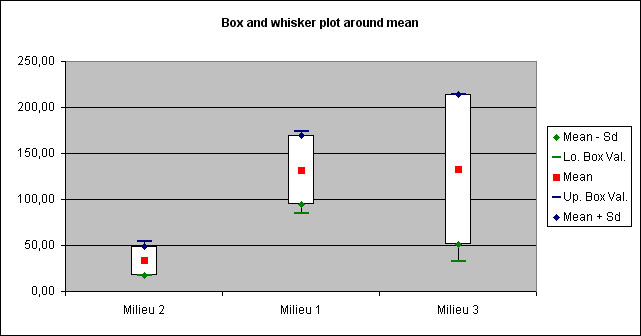
A "Whiskers plot" is displayed to illustrate results :
|
|
|
| |
|
ad Science Company - 55, Boulevard Pereire, 75017 PARIS - France
|
|
|
|