| |
Example : We have a medicine (already used for a long time) to cure a pathology and we wish to evluate efficiency of 2 new medicines for the same pathology. We proceed aleatory 3 samplings of different subjects, then we assign 1 medicine for each group. We measure a relevant quantitative parameter (supposed to be influenced by medicine) on every subjects of the 3 groups, that leads us to have 3 series of measures whose we can calculate means. The goal of Anova is to compare the 3 means in order to know if differences between the means are significant (i.e. due to influence of medicines) or simply due to chance.
1 - Principles of analysis of variance for independent groups :
We have several samples (K>2) whose means (mi, mj, ...) and variances (s²i, s²j, ...) are estimators of means (µi, µj, ...) and variances (θ²i, θ²j, ...) of populations from which samples are extracted. The problem is : si mi, mj, ... are differents (which is easy to check), is it the same for µi, µj, ... ?
- Null hypothesis : "H0 : µi = µj = ..."
- Alternative hypothesis : "H1 : there is at least one mean that is different from the others"
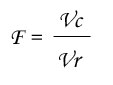
If means µi, µj, ... are not the sames, their estimations mi, mj, ... will be also different. The test consists in calculation of dispersion of calculated means. Anova, or Analysis Of Variance, relies on ratio between 2 variance estimations of measured parameter :
- first estimation is variance between populations, or between-groups variance, that is variance of measures due to influence of studied factor (in our case : influence of medicines),
- second estimation is variance inside population, or within-group variance, that is variance of measures due to variability between subjects (this variance should be statistically be the same whatever the group).
Thus, when the ratio "between-groups variance / within-group variance" is higher than a limit value, it means that variability is higher between groups than inside each group, i.e. variability due to studied factor is higher than variability due to subjects.
- We define :
- ni = number of measures in column i, N = total number of measures
- Ti = sum of measures of column i, Tg = total sum of measures (sum of Ti).
- K = number of column (number of different treatments)
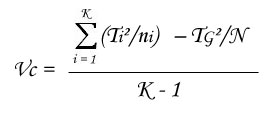
- Calculation of between-groups variance :
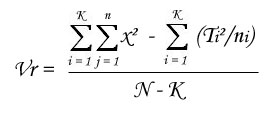
- Ratio of both has a Fisher's distribution under null hypothesis, F is then compared to limit value from Fisher's table with (K - 1) and (N - K) df, with a p-value (risk to make a mistake) lower than 5% :
- Conditions to use the test (automatically checked by StatEL) :
- Normal distribution of the samples
- Homogeneity of variances
At the end of Anova, StatEL resort 2 post-hoc tests in order to define conclusions of Anova in case of rejection of H0. Indeed, Anova does not allow to specify which mean(s) is (are) different from the others.
First post-hoc test is "Dunnett test" which is useful to determine if studied groups are different from 1 control group.
Second post-hoc test is "Newman & Keuls Test" which proceed multiple comparisons between groups by comparing gap between 2 groups with a theoretical value. Test is practiced on ranked group in order to avoid comparisons ofevery couples of means.
Ex : We have 4 different groups classed by increasing rank of their means m1 < m2 < m3 < m4.
If N&K test reveals that difference between m1 and m3 is not significant, it useless to compare m2 and m3 whose gap is lower, then obiously non-significant. This leads to not increase too much Type I Error Rate due to multiples comparaisons.
At last, according to results of N&K test, the different studied groups, whose gap is not significant, are gathered in order to present a synthesis of ANOVA.
2 - Launch of analysis of variance for independent groups :
StatEL requires you to specify the number of different groups you want to compare. Then, you have to select successively the cells range related to each studied group. This dialog boxwill display as many time as the number of different groups to compare. To proceed the selection, you just have to clic on the first cell of your data with the mouse and to stretch until the last cell of your data.
Nota bene : in order to identify the different measures groups, first cell of each selection must contain thename of the group. These names will be used in the results sheet.
Then, if calculations allow to reject H0 and and show a significant difference between means of the studied groups, a new dialog box offers you possibility to practice 5 post hoc tests. you can choose among:
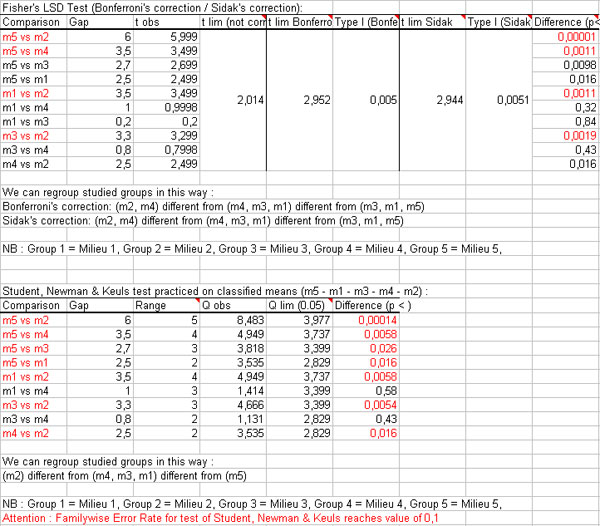
- LSD test of Fisher with corrections of Bonferroni and Sidak,
- HSD test of Tuckey,
- Student, Newman & Keuls test,
- Ryan test,
- test of Dunnett specific to comparison of every groups to a reference group, in this case StatEL needs you to choose the name of this reference group in the list.
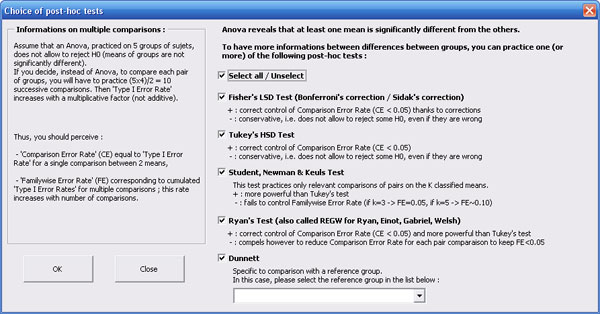
When your choice is over, please validate by clicking on the "OK" button.
3 - Results of analysis of variance for independent groups :
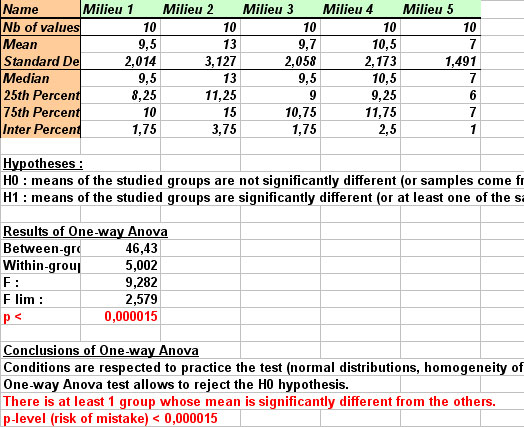
Results display on a new sheet of you Excel file :
- On the left part of the sheet, you can see table of selected data.
- On the right part of the sheet are displayed table of descriptive statistics, tested hypotheses, results of Anova calculation, and Anova conclusions. If results allow to reject H0 hypothesis, i.e. if at least one mean is significantly different, conclusions as well as p-value are written in red.
- If conditions of ANOVA are not respected, a red warning message is written, as well as the name of the nonparametric test analogous to ANOVA that you can use to perform a correct statistical analysis.
In the mentioned example, StatEL explains clearely that at least one mean is significantly different, with a p-value (risk to make a mistake) lower than 0,0053.
It is also specified that conditions of the test are respected (conditions checked with StatEL, transparently for the user) ; the user can thus trust results.
- Post-hoc tests are displayed next to conclusions of Anova.
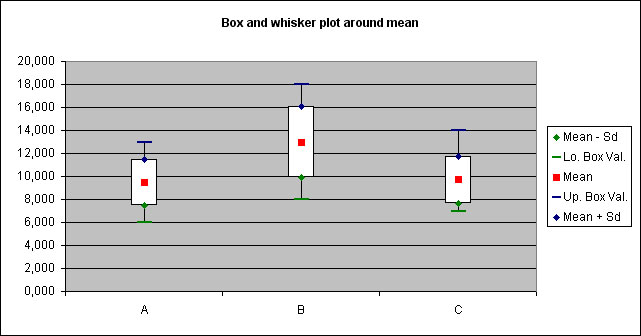
A "Whiskers plot" is displayed to illustrate results :
|