| |
This test is equivalent to parametric t-test for comparison of 2 means from dependent groups, but without requirement of sample distribution.
Example : we want to know impact of an anticholesterolemia treatment. We have a group of subjects and we measure for the first time (T0) their cholesterol rate. After treatment, we measure for the second time (T1) their cholesterol rate. Since we measure twice the same parameter on the same subjects, measures are not independent, we say that measures are dependent, or paired. The goal of our study is to compare the 2 means of cholesterol rate in order to know if gap between both is significant or simply due to chance..
1 - Principles of Wilcoxon test :
We have 2 samples a and b wose means (ma and mb) and variances (s²a and s²b) are estimators of means (µa and µb) and variances (θ²a et θ²b) of the 2 populations A and B from which samples are extracted. The question is : if ma and mb are different (which is easy to check), is it the same for µa and µb ?
- Null hypothesis : "H0 = µa and µb are equal"
- Alternative hypothesis : "H1 = µa and µb are different"
As both samples come from a unique group of subjects, analysis is different from Mann & Whitney test where samples were independant. In this new case, each measure from sample a is connected to its homologue from sample b. Principe of the test consists in calculation, for each pair of measure, of the difference between values. Then, calculation of Wilcoxon test consists in comparison of these differences mean.
In any nonparametric test, and on the contrary of parametric tests, calculation does not take into account numeric values of measures from samples representative of the populations. Nonparametric tests are based on ranks of values. Then we are free of normal distribution conditions and homogeneity of variances, indispensable for liability of parametric tests.
- We begin to calculate, for each data pair, the difference between both values. Then, we rank these calculated differences in rising order, but we keep their sign information.
- We calculate indexes M = sum of ranks for differences with a "minus" sign, and sum of ranks for differences with a "plus" sign ; then we will work with the lowest of both index.
- In null hypothesis where both samples come from a same population, it should be as many differences with sign "-" as differences with sign "+", and their absolute value should be average the sames. In the opposite case, one of both indexes trends to be higher than the other, and absolute value of its differences are also higher.
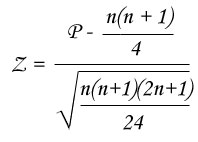
- We analyze significancy of this lowest index (P or M) by comparison with the limit value from the Z statistic table, only if there are at least 20 data pairs (if not, we have to resort Wilcoxon table) :
- There is no condition to use Wilcoxon test (excepted aleatory sampling).
2 - Launch of Wilcoxon test :
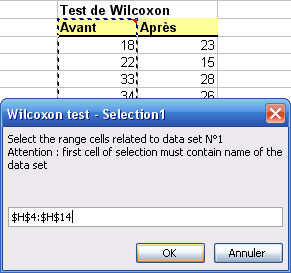
StatEL requires you to select the cells range related to the first studied group, then it needs you to select the cells range related to the second group of subjects. To proceed the selection, you just have to clic on the first cell of your data with the mouse and to stretch until the last cell of your data.
Nota bene : in order to identify at the best different measures groups, first cell of each selection must contain name of the group. These names will be used in the results sheet.
Nota bene : in Wilcoxon test, number of measures is supposed to be the same for each group. However, StatEL will manage missing data if, for each group, selection is applying on exactly the same number of cells (empty or not).
3 - Results of Wilcoxon test :
Results display on a new sheet of you Excel file :
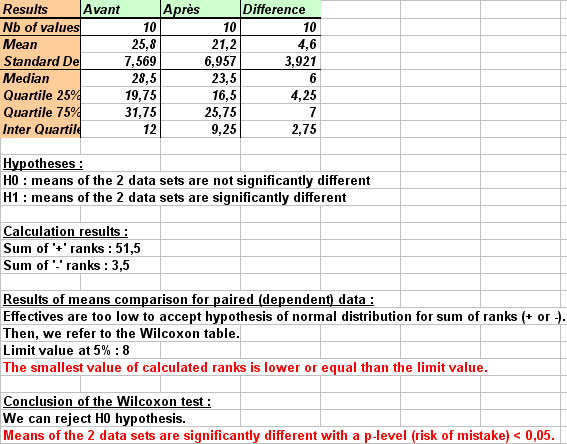
- On the left part of the sheet, you can see table of selected data.
- On the right part of the sheet are displayed table of descriptive statistics, tested hypotheses, results of Wilcoxon calculations, and Wilcoxon conclusions. If results allow to reject H0 hypothesis, i.e. if means of both groups are significantly different, conclusions as well as p-value are written in red.
In the mentioned example, StatEL explains clearely that means of the 2 groups are significantly different, with a p-value (risk to make a mistake) lower than 0,05.
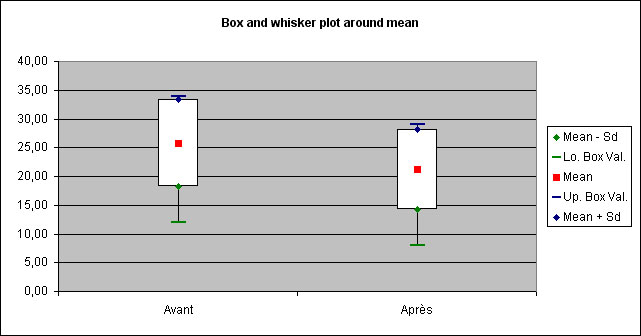
A "Whiskers plot" is displayed to illustrate results :
|