| |
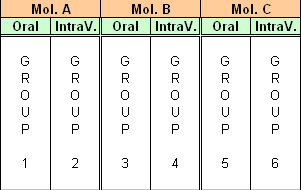
This test is usefull to compare means of one parameter measured on dependent or independent groups, jointly submitted to 2 experimental conditions or 2 factors (ex : 3 medicines and 2 ways of injection represent a total of 6 different combinations, thus 6 measures groups). This kind of study allows also to detect a prospective interaction between both studied factors.
Example : We want to compare efficiency of 3 different medicines and, jointly, we question about injection way (buccal or intravenous way). For all that, we can not multiply experiments and number of subjects. Then we have a total of 6 different combinations, i.e. 6 measures groups (on the sames subjects or different subjects) on which we measure a relevant quantitative parameter (supposed to be influenced by both studied factors). The goal of Anova is to compare the 6 means in order to know if differences between the means are significant (i.e. due to influence of medicines and/or injection way) or simply due to chance.
1 - Principles of two-way Anova :
Several hypothesis are (or can be) jointly tested by two-way Anova
- Relatively to Factor 1 (in our case the tested medicines) :
- Null hypothesis : "H0 : µ1i = µ1j = ..."
- Alternative hypothesis : "H1 : there is at least one mean that is different from the others"
- Relatively to Factor 2 (in our case the tested ways of injection) :
- Null hypothesis : "H0 : µ2i = µ2j = ..."
- Alternative hypothesis : "H1 : there is at least one mean that is different from the others"
- And optionnaly, relatively to interaction between both factors :
- Null hypothesis : "H0 : there is no interaction between both factors"
- Alternative hypothesis : "H1 : there is an interaction between both factors"
Different combinations of 2 factors compose a complete factorial design where :
- first factor has K1 levels, second factor has K2 levels
- factorial design is complete when every combinations are represented (total number of combination K = K1 x K2)
- complete factorial design is repeated (from 1 time to r times)
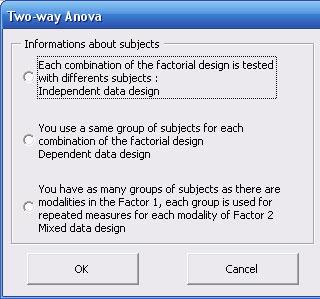
Two-way Anova may be practiced with different subjects for each combination of factorial design :
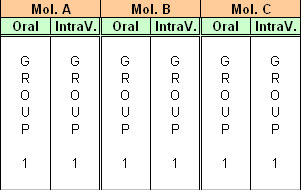
or with the same subjects :
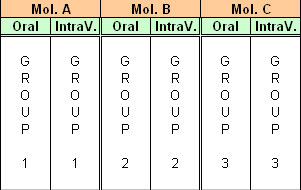
or with the same subjects only for one of both factors :
Thus after calculation of the different components of variance related to both studied factors, to interaction between both factors and the error variance, we proceed following calculations :
- Ratio between factor 1 variance and error variance (F1 = V1 / Vr) has a Fisher's distribution under null hypothesis, F1 is then compared to limit value from Fisher's table with (K1 - 1) and (N - K) df, with a p-value (risk to make a mistake) lower than. If F1 > Flim, we conclude there is a significant difference between modalities of factor 1.
- Ratio between factor 2 variance and error variance (F2 = V2 / Vr) has a Fisher's distribution under null hypothesis, F2 is then compared to limit value from Fisher's table with (K2 - 1) and (N - K) df, with a p-value (risk to make a mistake) lower than. If F2 > Flim, we conclude there is a significant difference between modalities of factor 2.
- Ratio between interaction variance and error variance (Fi = Vi / Vr) has a Fisher's distribution under null hypothesis, Fi is then compared to limit value from Fisher's table with (K - K1 - K2 - 1) and (N - K) df, with a p-value (risk to make a mistake) lower than. If F2 > Flim, we conclude there is a significant interaction between both factors.
Conditions to use the test (automatically checked by StatEL) :
- Normal distribution of the samples.
- In case of Anova on independent groups (if subjects are different), we must check homogeneity of variances.
- In case of Anova on dependent groups (if subjects are the sames), we must check homogeneity of variances / covariances, as well as sphericity test.
At the end of Anova, StatEL resort 2 post-hoc tests in order to define conclusions of Anova in case of rejection of H0. Indeed, Anova does not allow to specify which mean(s) is (are) different from the others.
First post-hoc test is "Dunnett test" which is useful to determine if studied groups are different from 1 control group.
Second post-hoc test is "Newman & Keuls Test" which proceed multiple comparisons between groups by comparing gap between 2 groups with a theoretical value. Test is practiced on ranked group in order to avoid comparisons ofevery couples of means.
Ex : We have 4 different groups classed by increasing rank of their means m1 < m2 < m3 < m4.
If N&K test reveals that difference between m1 and m3 is not significant, it useless to compare m2 and m3 whose gap is lower, then obiously non-significant. This leads to not increase too much Type I Error Rate due to multiples comparaisons.
At last, according to results of N&K test, the different studied groups, whose gap is not significant, are gathered in order to present a synthesis of ANOVA.
2 - Launch of two-way Anova :
StatEL needs you to specify the configuration of your experimental protocol.
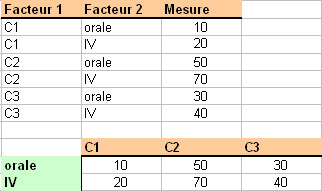
2.1 - Without repetition of the factorial design :
Data may be organized in rows (or in columns) or measures of each factor may be crossed in a table :
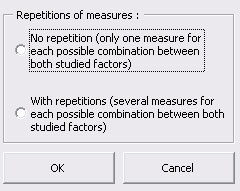
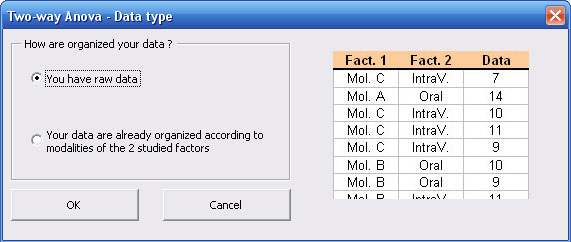
2.2 - With repetitions of the factorial design :
StatEL requires you to specify the way your data are organized (numbered or not).
You may work on :
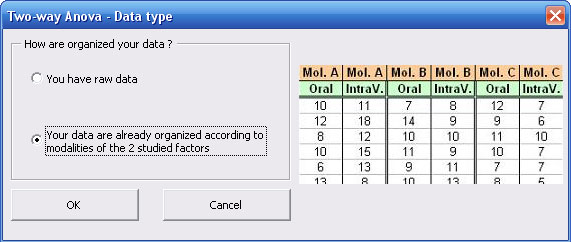
- numbered data and organized in a table :
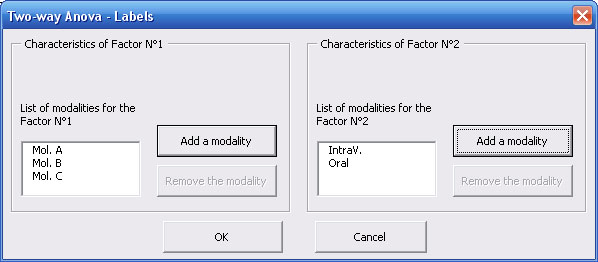
Whatever your choice, next procedure will be the same, you have to specify modalities of the 2 studied factors (in the example, factor N°1 has 3 modalities : medicine A, B and C, whereas factor N°2 has 2 modalities : buccal and intravenous).
Nota bene : in two-way Anova, number of measures is supposed to be the same for each group. However, will manage missing data if, for each group, selection is applying on exactly the same number of cells (empty or not).
3 - Results of two-way Anova :
Results display on a new sheet of you Excel file :
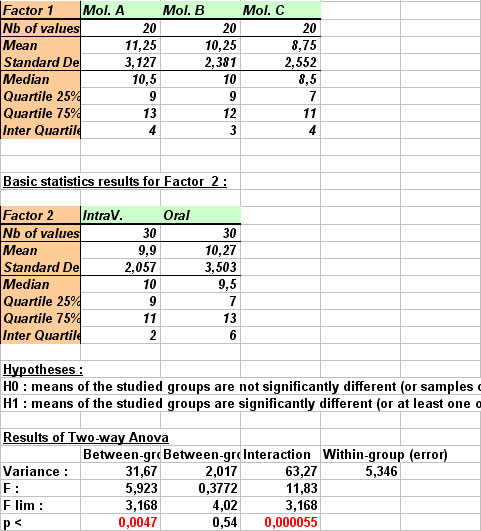
- On the left part of the sheet, you can see table of selected data.
- On the right part of the sheet are displayed table of descriptive statistics, tested hypotheses, results of Anova calculation, and Anova conclusions. If results allow to reject H0 hypothesis, i.e. if at least one mean is significantly different, conclusions as well as p-value are written in red.
- If conditions of ANOVA are not respected, a red warning message is written.
Il est notamment précisé à l'utilisateur que les conditions d'utilisation de ce test sont respectées (conditions vérifiées par StatEL de façon transparente à l'utilisateur) ; il peut donc se fier à la conclusion présentée.
In the mentioned example, StatEL explains clearely that at least one mean of Factor 1 (i.e. nature of medicine) is significantly different, with a p-value (risk to make a mistake) lower than 0,0047. On the other hand, Factor 2 analysis (i.e. injection way) does not allow to reject H0 hypothesis, thus it does not influence the studied parameter mean.
Since Anova detected a significant difference between means of Factor 1, StatEL proceeded to posthoc Newman & Keuls' test. Conclusions are that only modality 3 of Factor 1 (i.e. medicine C) shows a significantly different mean :
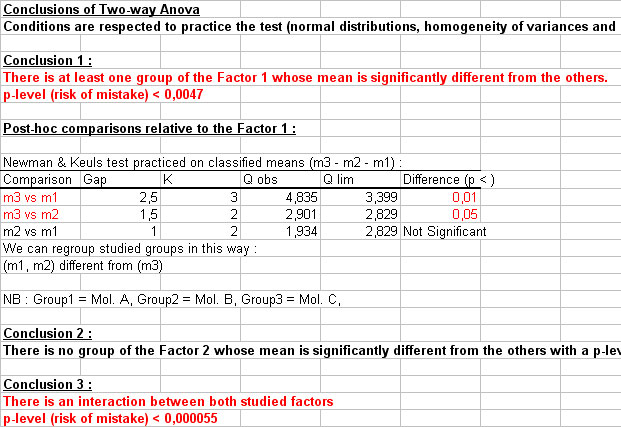
StatEL specifies also there is a significant interaction between both studied facteurs (with a p-value (risk to make a mistake) lower than 0.000055), that we can visualize on the first graph :
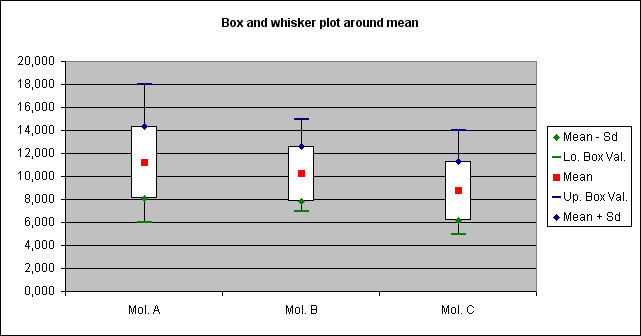
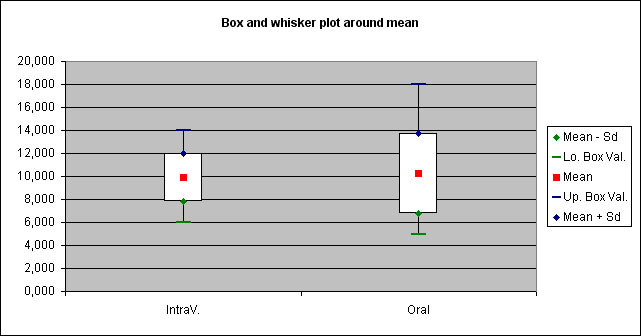
At last, "Whiskers plot" are displayed to illustrate other results :
|