Example : in a candies factory, we want to know if candy bags, automatically filled with machines, have a weight that does not differ too much from 65g. Thus, we select aleatory n bags, all weighed with the same machine and we calculate the mean weight (that is not exactly 65g). The goal of our study is to compare this observed mean weight with a theoretical weight in order to know if gap between both weights is significant or simply due to chance.
1 - Principles of comparaison test of an observed mean with a theoretical mean :
We have a sample whose mean (m) and variance (s²) are estimators of the mean (µ) and of variance (θ²) of the population from which sample has been extracted. The question is : if m is different from a theoretical µ0 (which is easy to check), is it the same for µ ?
- Null hypothesis : "H0 = µ and µ0 are equal"
- Alternative hypothesis : "H1 = µ and µ0 are different"
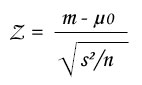
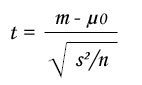
We check values of the difference d = (m - µ0). If sample comes from theoretical population, d will be, in mean, near from 0.
- In case of great effectives (n > 30), we compare Z value with the limit value from the Z statistic table :
- In case of small effectives, we compare t value with the limit value from the Student table with df = n - 1 :
- Conditions to use the test (automatically checked by StatEL) : normal distribution of the sample
2 - Launch of comparaison test of an observed mean with a theoretical mean :
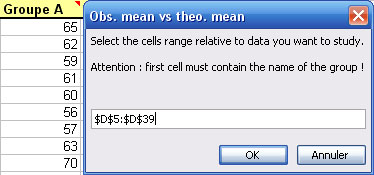
StatEL requires you to select the cells range of the studied group. To proceed the selection, you just have to clic on the first cell of your data with the mouse and to stretch until the last cell of your data. Then, you just have to specify the value of theoretical mean.
3 - Results of comparaison test of an observed mean with a theoretical mean :
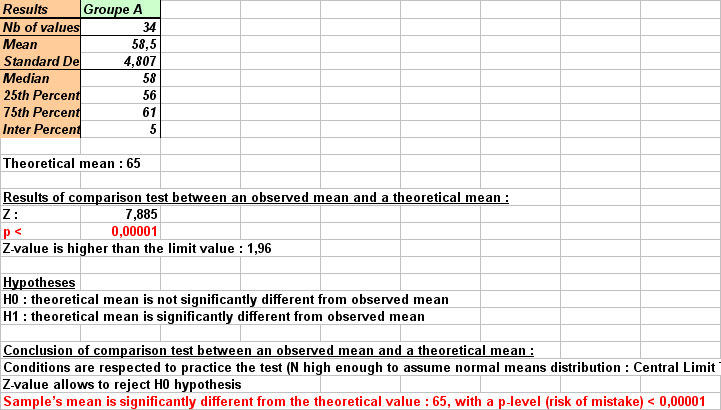
Results display on a new sheet of you Excel file :
- table of selected data on the left
- table of descriptive statistics
- calculation results
- tested hypothesis
- litteral conclusions of the test
In the mentioned example, StatEL explains clearely that the observed mean is significantly different from the theoretical mean 65, with a p-value (risk to make a mistake) lower than 0,00001.
It is also specified that conditions of the test are respected (conditions checked with StatEL transparently for the user) ; the user can thus trust results.
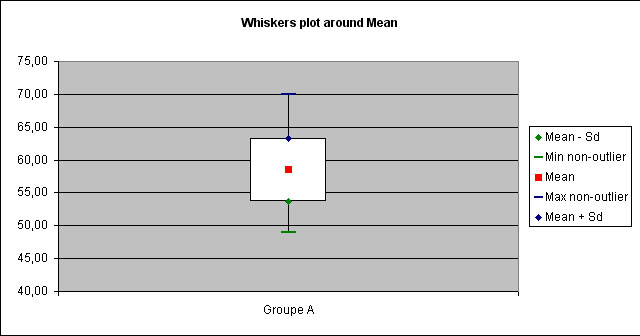
A "Whiskers plot" is displayed to illustrate results :
|