This test is equivalent to parametric t-test for comparison of 2 means from independent groups, but without requirement of sample distribution.
Example : we want to compare evolution of mean weight on a group of women and a group of men who followed the same diet, in order to detect if gender has an influence on efficiency of the diet (considering that other influent factors have been fixed). The goal of our study is to compare the 2 mean variations of weights in order to know if gap between both is significant or simply due to chance.
1 - Principles of Mann & Whitney test :
We have 2 samples a and b wose means (ma and mb) and variances (s²a and s²b) are estimators of means (µa and µb) and variances (θ²a et θ²b) of the 2 populations A and B from which samples are extracted. The question is : if ma and mb are different (which is easy to check), is it the same for µa and µb ?
- Null hypothesis : "H0 = µa and µb are equal"
- Alternative hypothesis : "H1 = µa and µb are different"
In any nonparametric test, and on the contrary of parametric tests, calculation does not take into account numeric values of measures from samples representative of the populations. Nonparametric tests are based on ranks of values. Then we are free of normal distribution conditions and homogeneity of variances, indispensable for liability of parametric tests.
- Thus, we begin to rank in rising order the whole values of both studied groups, and we calculate sum of ranks for each of both groups (Wa and Wb).
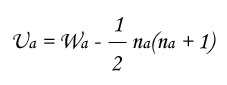
- We calculate the Mann/Whitney indexes (Ua and Ub) to know the lowest U index between both groups :
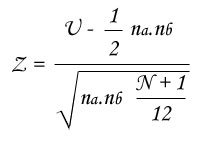
- We test significancy of this lowest U index by comparison with the limit value from the Z statistic table, only if each group has at least 10 measures (if not, we have to resort U table) :
- There is no condition to use Mann & Whitney test (excepted aleatory sampling).
2 - Launch of Mann & Whitney test :
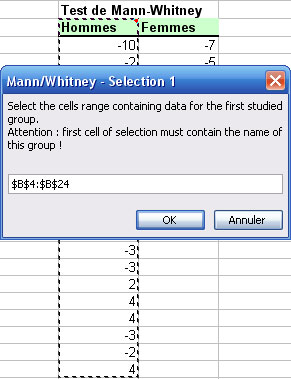
StatEL requires you to select the cells range related to the first studied group, then it needs you to select the cells range related to the second group of subjects. To proceed the selection, you just have to clic on the first cell of your data with the mouse and to stretch until the last cell of your data.
Nota bene : in order to identify at the best different measures groups, first cell of each selection must contain name of the group. These names will be used in the results sheet.
3 - Results of Mann & Whitney test :
Results display on a new sheet of you Excel file :
- On the left part of the sheet, you can see table of selected data.
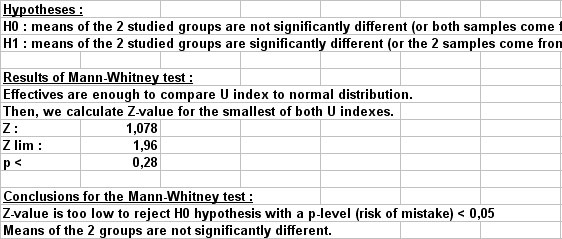
- On the right part of the sheet are displayed table of descriptive statistics, tested hypotheses, results of Mann & Whitney calculations, and Mann & Whitney conclusions. If results allow to reject H0 hypothesis, i.e. if means of both groups are significantly different, conclusions as well as p-value are written in red.
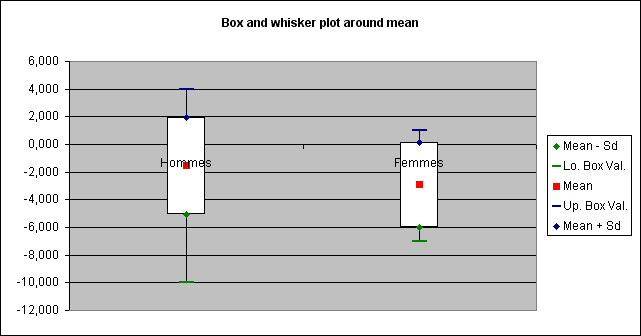
In the mentioned example, StatEL explains clearely that means of the 2 groups are not significantly different, with a p-value (risk to make a mistake) lower than 0,05.
A "Whiskers plot" is displayed to illustrate results :
|