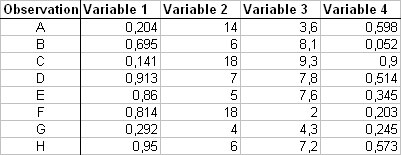
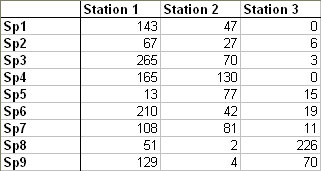
This command launches procedure of classification of observations from a measures table (cf. PCA) or modalities of a qualitative variable from a contingency table (cf. CA) :
1 - Principles of Hierarchical Classification - HC :
Principle of HC is to gather observations or modalities of a qualitative variable according to a specified resemblance criteria. The most "similar" observations are then gathered inside homogeneous groups.
Classification is ascending because it begins individual observations ; it is hierarchical because it produce classes or groups increasingly vast, including more and more sub-groups.
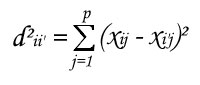
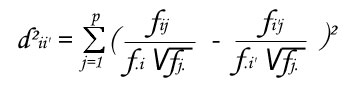
Notion of ''resemblance'' between observations is evaluated by distance between points : euclidian distance in case of observations from a measures table or Khi² distance in case of modalities of a qualitative variable from a contingency table.
Considering i and i', 2 points whose we want to evaluate distance from a p parameters table,
It is necessary to specify the way to calculate distance between 2 classes, this is the aggregation criteria that is used to calculate the ''resemblance'' between groups :
- minimum distance (the distance between 2 groups is the shortest),
- maximum distance (the distance between 2 groups is the longest),
- mean distance (the distance between 2 groups is the the distance between centers of gravity of groups),
- algorithm of Ward or variance distance(the distance between 2 groups makes reduced intra-group variance and high inter-group variance) .
2 - Launch of Hierarchical Classification - HC :
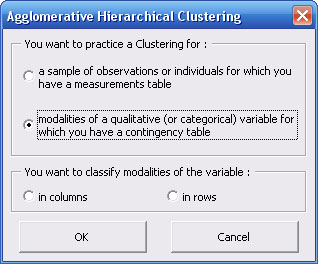
First dialog box alows you to choose which kind of data you want to classify : observations (from a measures table) or modalities of a qualitative variable (from a contingency table).
If you choose "modalities of a qualitative variable" option, you must specify which one of both variables from the contingency table you want to classify (in rows or in columns).
2.1 Classification of observations from a measurements table :
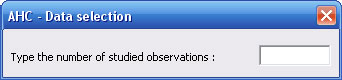
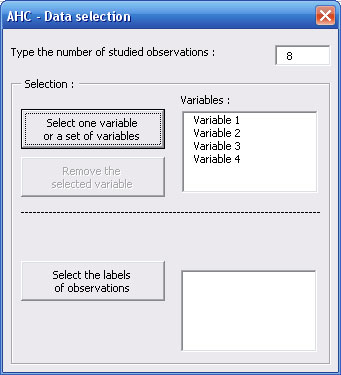
First you have to specify the number of observations.
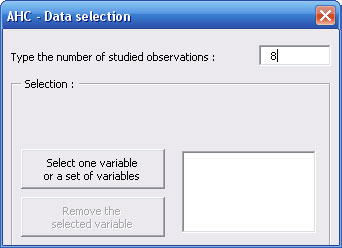
Dialog box is revealing to show you a button allowing you to select the data set.
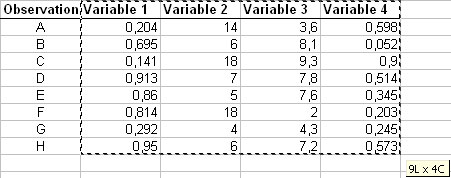
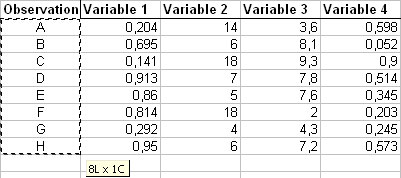
Click on this button and select variables you want to study with the name of each variable in the first cell of each column.
You can select the whole table at the same time, or if columns of your table are not contiguous, you can select it in several times always by clicking on the same button.
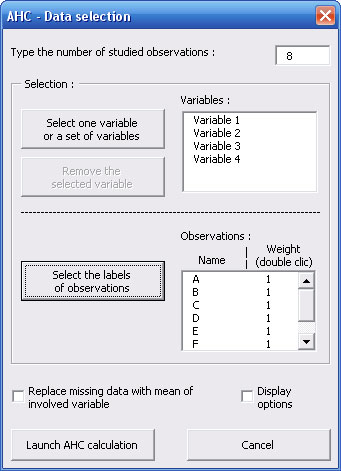
Variables' names appear in a list of the dialog box which is revealing again to allow you to select names of observations.
On the same way, click on the second button and select the names of observations.
Observations' names appear in the second list.
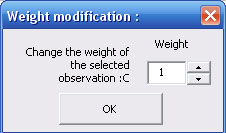
On Windows version you can notice the presence, on both lists, of a "1" column in front of each name of variable and observation : it is the weight by default. You can change a weight by double-click on it, that makes appear a new dialog box :
Nota bene : by default, data are standardized, if you want to do calculations with raw data, you can change it by ticking the checkbox for options.
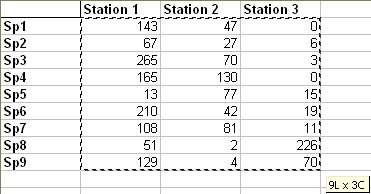
2.2 Classification of modalities of a qualitative variable :
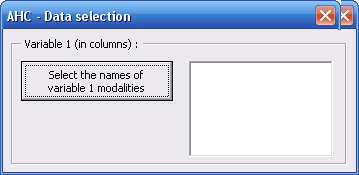
Initial dialog box (partially revealed) allows you to select the names of modalities for variable 1 (in columns).
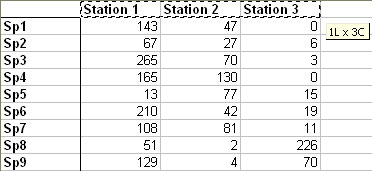
Click on the first button and select cells that contain the names of each column.
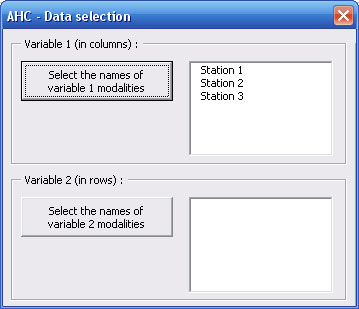
Names of modalities for variable 1 appear in the upper list of the dialog box which spreads to allow you to select the names of modalities for variable 2 (in rows).
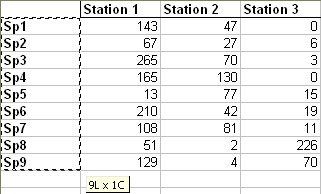
On the same way that previously, click on the second button and select cells that contain the names of each row.
Names of modalities for variable 2 appear in the second list of the dialog box which spreads to allow you to select the contingency table.
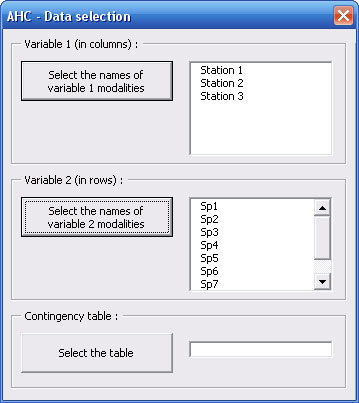
Now you just have to select cells containing effectives of contingency table by clicking on the third button.
2.3 Common options :
The checkbox of the dialog box allows you to spread it and offers you possibility to change the aggregation criteria between classes. By default, the aggregation criteria is the algorithm of Ward.
3 - Results of Hierarchical Classification - HC :
Results are displayed on a new Excel sheet.
Please notice that some cells have comments to explain their content (red triangle).
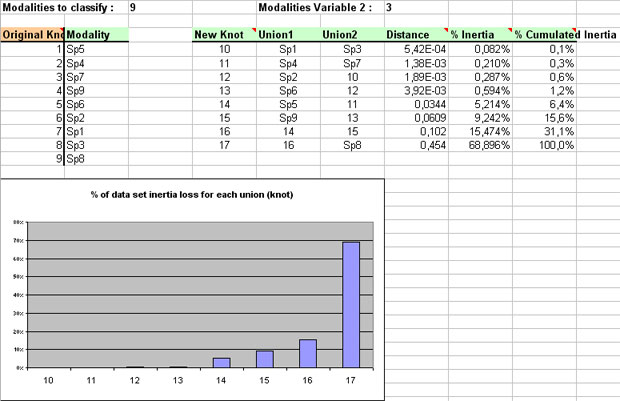
Details of analysis are displayed upper left of the results sheet :
- a 2 columns table to list items you want to classify with, for each one, a number of knot (each observation ormodality constitutes a class),
- on the right, the table with characteristics of new knots (= union of 2 classes),
- a first graph displaying percentage of variance of points lost at each knot,
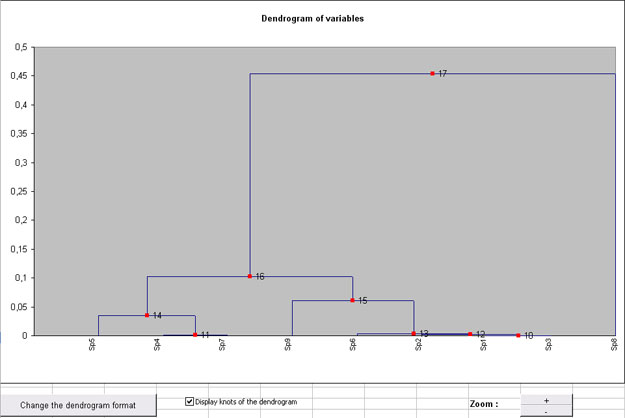
- a 2nd graph which synthesizes the whole classification, called "Dendrogram", and that you can read like a genealogical tree : 2 observations or modalities are "similar" or close if the knot that gathers them is low on the graph.
Below the last graph, you have possibility to :
- increase or decrease the scale of ordinate axis,
- display or hide knots and their number on the dendrogram,
- change the representation way of dendrogram (for Windows versions only).
|