This command launches procedure to detect presence of extreme values among measurements of a quantitative variable.
1 - Rosner and Dixon tests
Two tests are accessible from this command ; number of data will decide which one can be executed.
1.1. Dixon Test
Dixon's test will be practiced if N < or = 25 and can only detect one extreme value (i.e. the most distant from sample's mean).
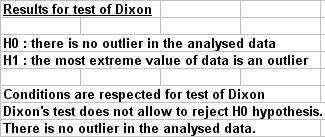
- Null hypothesis : "H0 = there is no extreme value"
- Alternative hypothesis : "H1 = tested value is an extreme value, or tested value does not belong to the same population than the one from which has been extracted the studied sample"
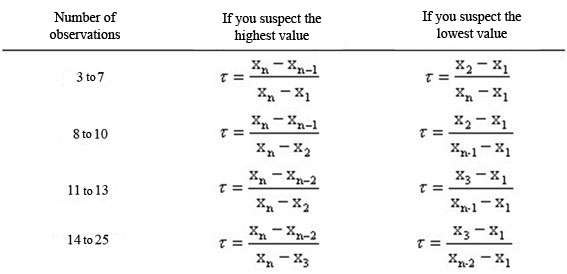
Calculation changes according to number of subjects to study, we calculate a Tau value that we compare to a limit value from Dixon's table :
If this Tau value exceeds limit value for alpha < 0.05, we reject H0 hypothesis and we consider that the tested value is an extreme value.
Dixon test requires a normal distribution of the tested sample.
1.2. Rosner Test
Rosner test will be practiced if 25 < N < 500 and allows to detect until 10 extreme values (i.e. the most distant from sample's mean).
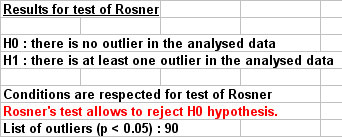
- Null hypothesis : "H0 = there is no extreme value"
- Alternative hypothesis : "H1 = there is at least one extreme value, or every values of the sample do not belong to a same population"
Rosner test is based on mean and Sd calculations of the sample from which every suspected values have been removed, except tested value. Then we start to test the least extreme suspected value (i.e. the least distant from the mean's sample, among the 10 most distant values), and we carry on with the more and more distant values.
By example, we suspect 3 values to be extreme (x1, x2, x3, classified from the most distant to the least distant from sample's mean) on a sample of N measures. First we calculate m' and Sd' on the sub-group (N - 2) without x1 and x2 values. This sub-group should verify normality conditions. The R value is compared to a limit value extracted from Rosner's table :
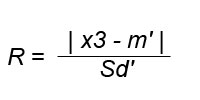
If this R value exceeds limit value for alpha < 0.05, we reject H0 hypothesis and we consider that the tested value (x3) is an extreme value, and that pther values (which are more distant from sample's mean than x3), are also extreme values.
If this R value does not exceed limit value for alpha < 0.05, we do not reject H0 hypothesis (x3 is not an extreme value) and we carry on Rosner's test with x2 (the next more distant value from sample's mean after x3).
StatEL requires you to select the cells range related to data you want to test presence of extreme values. To proceed the selection, you just have to click on the first cell of your data with the mouse and to stretch until the last cell of your data.
Nota bene : in order to identify at the best different measures groups, first cell of each selection must contain name of the group. These names will be used in the results sheet.
3 - Results of Rosner and Dixon tests :