| |
This command launches analysis procedure of a contingency table (table of number of subjects according to crossed modalities of 2 qualitative variables counted on a sample of observations) :
1 - Principles of Correspondences Analysis :
Principle of CA is to synthesize informations contained in a contingency table (C columns x L rows), by focusing on relative values rather than on raw values, i.e. correspondences between modalities of 2 variables.
CA allows to detect axes by which points (= modalities of qualitatives variables) spread the most from the center of inertia. These "synthetic" axes may result of influence of one or several variables or observations.
Thus, by projection of points (observations or variables) on plans defined by these new axes, we have a representative "photograph" of points.
By analogy, imagine someone is trying you to recognize an animal drawn on a paper sheet (that is a camel) but you see only its face shape. You can not conclude if it is a camel or a dromedary, just because angle of analysis is not the most informative. You need a profile image of the animal to conclude with certitude that it is a camel. On the same way, CA calculates new axes (and then plans) able to advise you at the best about repartition of points.
On a technical point of view, it requires diagonalisation of inertia matrix. We proceed to transformation of measures table on this way :
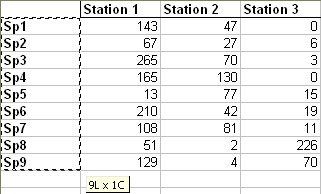
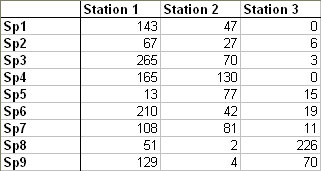
- a contingency table crossing c columns and l rows,
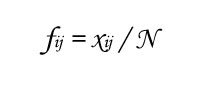
- xij is the number of observations for column i and row j,
- N is the total number of observations,
- i varies from 1 to c, j varies from 1 to l,
- fij is the proportion of number of observations for column i and row j :
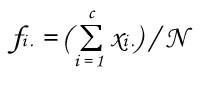
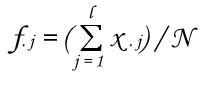
We calculate fi. and f.j :
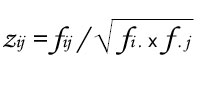
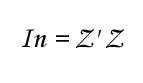
Then we calculate zij :
We obtain the matrix Z (l, c) from which we calculate inertia matrix of observations :
After diagonalisation of this matrix, we extract C-1 (or L-1 if L is lower than C) eigenvalues (λ) and matrix of eigenvectors (u) that will define new axes. Eigenvectors help to find points projection on plans defined by new axes, whereas eigenvalues (1 per axis) evaluate quantity of variance (or inertia) of points explained by each axis.
At the end of CA, we can represent modalities of variable 1 as well as modalities of variable 2. These both representations help to detect which modalities are the most influent to extraction of new axex by CA, and how these modalities are related.
Eventually, it is possible to add some "ilustrative" points in both representations. These points are not used to define new axes, but they are added in the representations for helping interpretation of new axes.
Nota bene : CA realized on a same data set with differents softwares may supply different representations, some axes are inverted. There is no mistake, but the result of the way inertia matrix has been diagonalized.
In spite of differences in graphs, you can notice that related positions of points are always the sames (as well as results of contribution, quality and distance - cf. below). Indeed specificity of CA is to proceed analysis of data, the ones compared to the others.
2 - Launch of Correspondences Analysis :
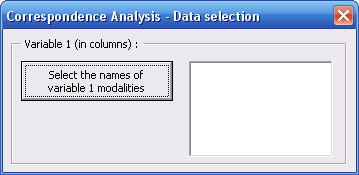
Initial dialog box (partially revealed) allows you to select the names of modalities for variable 1 (in columns).
Click on the first button and select cells that contain the names of each column.
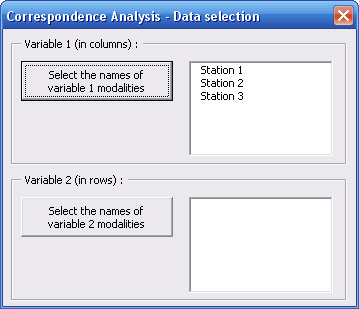
Names of modalities for variable 1 appear in the upper list of the dialog box which spreads to allow you to select the names of modalities for variable 2 (in rows).
On the same way that previously, click on the second button and select cells that contain the names of each row.
Names of modalities for variable 2 appear in the second list of the dialog box which spreads to allow you to select the contingency table.
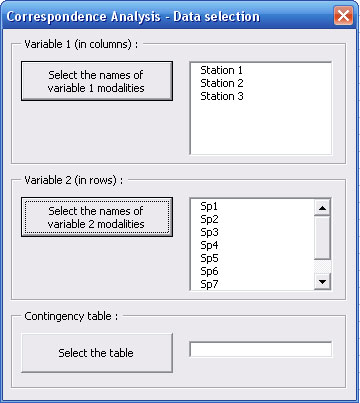
Now you just have to select cells containing effectives of contingency table by clicking on the third button.
A check box allows to spread the dialog box in order to change some modalities as illustrative.
3 - Results of Correspondences Analysis :
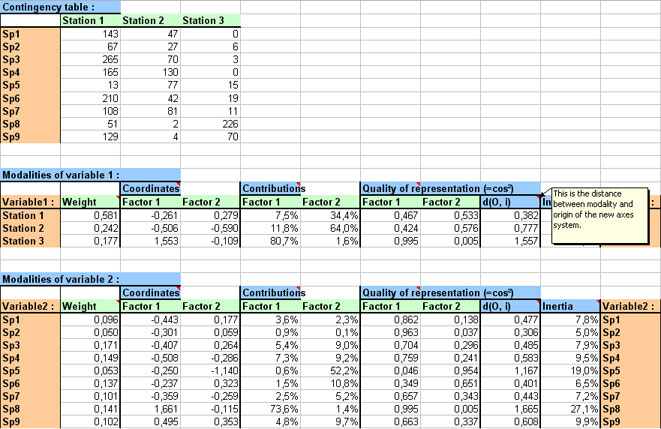
Results are displayed on a new Excel sheet.
Please notice that some cells have comments to explain their content (red triangle).
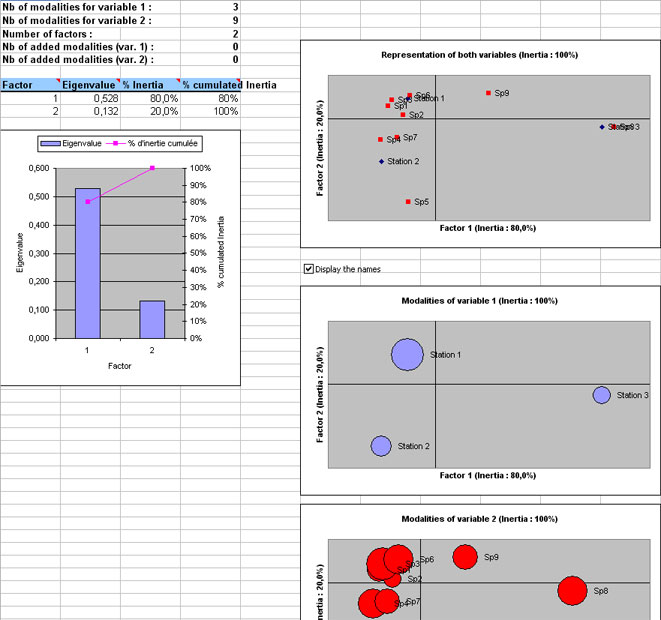
Details of analysis are displayed upper left of the results sheet :
- nb of modalities for variable 1 (in columns),
- nb of modalities for variable 2 (in rows),
- nb of factors (axes) extracted by CA,
- nb of illustrative modalities (related to variable 1),
- nb of illustrative modalities (related to variable 2).
Below these recalls are displayed characteristics of new axes (or factors) of PCA, as well as a resume of them on a graph.
In the middle of the results sheet, you can see 3 graphs representing :
- modalities of both variables conjointly,
- modalities of variable 1 (where size of points is related to number of subjects for each modality),
- modalities of variable 2 (where size of points is related to number of subjects for each modality).
A check box allows you to display names of points on graphical representations. Furthermore, if you specified illustrative points, a second check box allows you to visualize them on graphs.
Notice that above these graphs, you can change axes on representations (abscissa and ordinate) by clicking on "Up/Down arrows" (only if more than 2 factors are extracteds by CA).
On the right part of the results sheet are displayed every numerical data necessary for CA :
- recall of studiedcontingency table,
- data related to representation of modalities for variable 1,
- data related to representation of modalities for variable 2.
For these 2 last items, numerical data are the same :
- the weights of each modality,
- coordinates of points in the graphs,
- points' contributions that represent importance of each modality in variance of each factor,
- qualities of representation (or cos²) that inform on angle between the line linking center of points to studied point, and the considered axis. If cos² is close to 1, it implies that this angle is close to 0 ; thus if projection of a point is close to an axis, this point will be, in space, indeed close to the axis,
- distances of points from center of points,
- inertia that expresses percentage of variance of points explained by the considered modality.
|