1 - Principles of the Q test of Cochran :
We have 3 samples a, b and c whose proportions of different modalities of a qualitative variable are estimators of proportions of different modalitiesfor the same qualitative variable in the 3 populations A, B and C from where are extracted the 3 analyzed samples. The question is : if proportions are different between the 3 samples (that is easy to check), is it the same for the 3 populations ?
Another way to question is to ask if the 3 samples are extracted from only one population or from 2 or more different populations.
- Null hypothesis : "H0 = pa, pb and pc (proportions of studied parameter in both populations) are the same"
- Alternative hypothesis : "H1 = at least one of the population is different from the others"
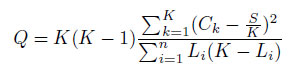
Q test of Cochran is a generalization of the test of McNemar, then it can only be practiced in the case of a qualitative variable with 2 differents modalites (binaire qualitative variable). The statistic of Cochran is defined as follows :
- K : the number of groups to compare
- Ck : the number of "1" in the kst column
- Li : the number of "1" in the ist line
- S : the sum of the whole table.
Under the H0 hypothesis, the statistic of Cochran follows a Khi² distribution with K-1 degrees of freedom.
If H0 has been rejected, StatEL practices a posthoc test to identify which of the groups is (or are) significantlyt different from the others. This one takes into account the increasing "Family Rate Error", induced by the multiple comparisons.
2 - Launch of the Q test of Cochran :
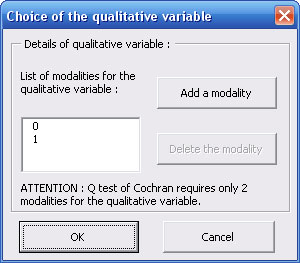
First, StatEL needs you to specify the different modalities contained in the studied qualitative variable :
By default, modalities of the coding variable are "0" and "1". You can remove them by selecting them in the "List of modalities" and by clicking on the "Remove the modality" button. Then, specify one by one each modality of the coding variable by clicking on "Add a modality".
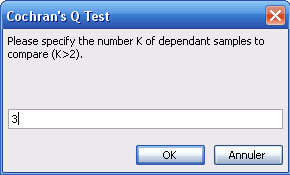
StatEL asks the number of groups to compare :
Then, StatEL requires you to select successively the cells range related to each studied group. This dialog boxwill display as many time as the number of different groups to compare. To proceed the selection, you just have to clic on the first cell of your data with the mouse and to stretch until the last cell of your data.
Nota bene : in order to identify the different measures groups, first cell of each selection must contain the name of the group. These names will be used in the results sheet.
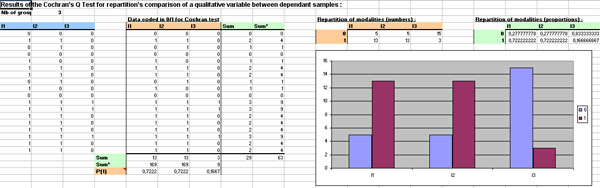
3 - Results of the Q test of Cochran :
Results display on a new sheet of you Excel file :
- tables of the observed effectives,
- tables of the 0/1 transformed data,
- repartition of the modalities in effectives and proportions
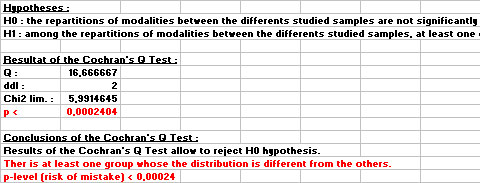
- tested hypotheses
- p level
- litteral conclusions of the test
In the mentioned example, StatEL explains clearely that at least one distribution of the studied qualitative variable is significantly different from the others, with a p-value (risk to make a mistake) lower than 0,00024.
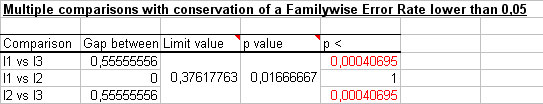
Then, StatEL displays the results of a posthoc test in order to specify which group(s) is (are) different from the other(s) :
|