1 - Principles of ROC curve :
What is difficult to establich a proper diagnostic test is to find the correct threshold value that will differenciate a positive and a negative.
Indeed, if threshold is too low, we will consider too many people in the "disease" category, and sensitivity of the test is excellent. However, la specificity of this test is very bad because a lot of these subjects are "False Positive" and will be wrongly included in series of medical treatment.
On the contrary, a too high threshold gives the test a good specificity (few healthy people are included in the "disease" category), but sensitivity is very bad because test leaves many subjects that have trully the disease and that will not be included in series of medical treatment whereas they need them.
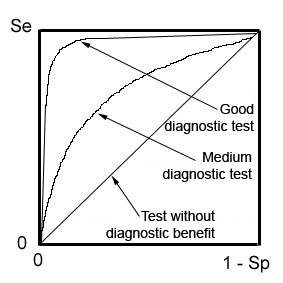
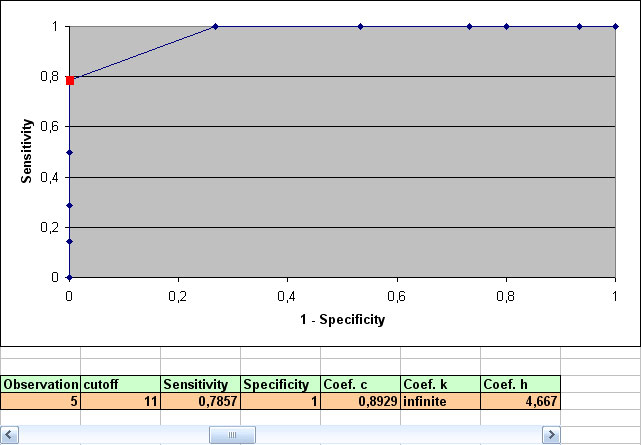
The best threshold for a medical test is the value for which sensitivity and specificity are the highest at the same time, that is a test able to detect the maximum number of patients that have the disease and to leave the maximum number of healthy patients.
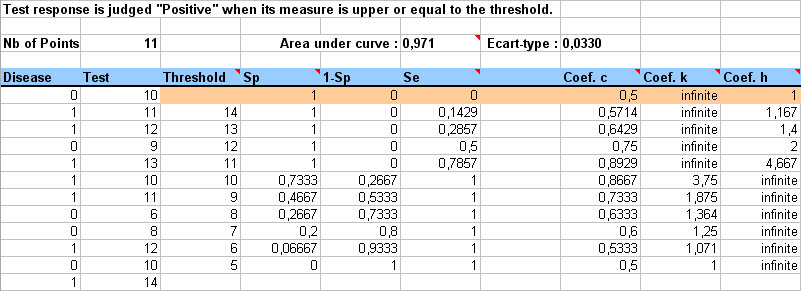
ROC (Receiving Operator Characteristics) curve allows to find this threshold value by displaying sensitivity (Se) on the Y-axis and 1 minus specificity (1-Sp) on the X-axis :
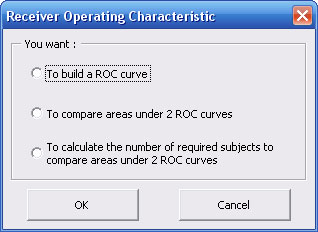
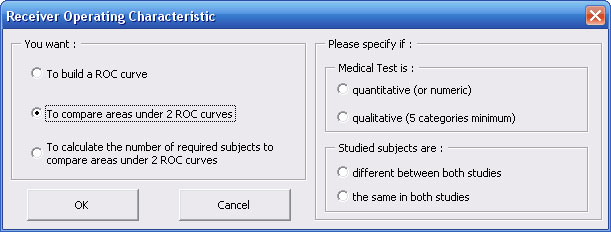
According to your first choice, you are free to work on binary or numeric diagnostic test, and with different or dependent samples in case of 2 ROC curves comparison :
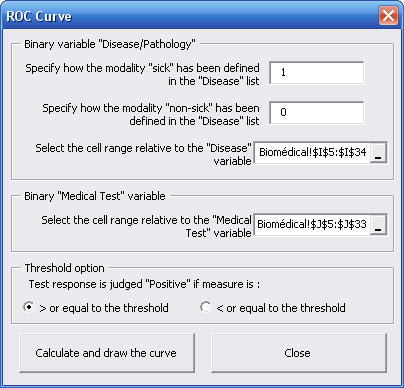
You have to specify how are identified subjects that have the studied disease and healthy subjects, then you have to select the cells range relative to the "Disease" variable as well as the cells range relative to the "Diagnosis" or "Medical Test" variable.
Nota bene : every selection must contain the same number of cells, otherwise a warning message will pop up.